


Amazon inventory forecasting is the process of deciding what to reorder, when to reorder it, and how much safety stock to carry so you stay in stock without burning cash on inventory you can't sell.
Get it right and you protect sales, avoid stockouts, and keep storage costs reasonable. Get it wrong and you either lose rank from running out of stock or tie up cash in slow-moving inventory that racks up aged inventory fees.
This is not guesswork. It is a repeatable process built on sales velocity, lead times, and safety stock. Here's how to do it.
Why Amazon Inventory Forecasting Matters More Than Ever
Forecasting used to be a planning problem. Now it is also a fee problem and a ranking problem.

The cost of stockouts
When you run out of stock on Amazon, you lose:
Sales. Obviously.
Organic rank. Amazon's algorithm sees that you can't fulfill demand and drops you in search results.
Buy Box share. Competitors take the Buy Box while you're out of stock, and you don't always get it back immediately when you restock.
Momentum. It can take weeks to rebuild velocity after a stockout, especially if your listings lost rank.
Stockouts are expensive in ways that do not always show up in a P&L line item.
The cost of overstock and aging inventory
Ordering too much creates different problems:
Cash drag. Inventory sitting in FBA is cash you cannot deploy anywhere else.
Storage fees. Standard monthly storage fees apply to all FBA inventory, and aged inventory fees hit units that sit unsold for more than 271 days (9+ months).
Low sell-through risk. If inventory does not turn, it shows up in your IPI score and inventory health metrics, which can lead to storage limits.
Margin erosion. Slow movers often get discounted or liquidated at a loss just to clear the inventory.
Where forecasting affects rank, cash flow, and fees
Amazon introduced a low-inventory-level fee in 2024 that applies when both your 30-day and 90-day historical days of supply fall below 28 days for eligible FBA products. Products with fewer than 20 units sold in the last 7 days are exempt, but for higher-velocity SKUs, running too lean now costs money per unit.
That means forecasting is not just about staying in stock. It is about staying in stock at the right level to avoid fee exposure while still protecting rank and sales.
The Inputs You Need Before You Build a Forecast
You cannot forecast without clean data. Here's what you need:
Historical sales by 30, 60, and 90 days
Pull unit sales from Seller Central for the last 30, 60, and 90 days. Use all three windows, not just one. Shorter windows show recent changes. Longer windows smooth out noise.
If your product has been live for more than a year, also pull year-over-year sales for the same period last year. That helps catch seasonality you might miss looking at recent months alone.
Lead times from PO to sellable FBA inventory
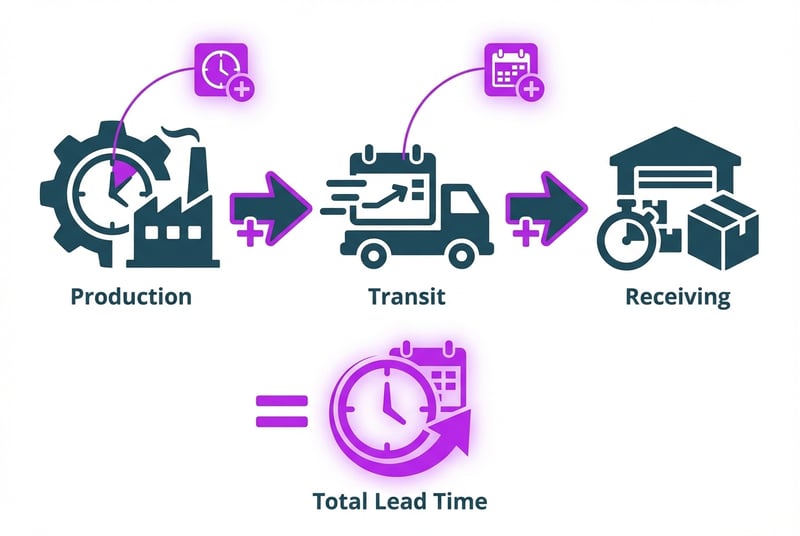
Total lead time is not just your supplier's production time. It includes:
- Supplier production time
- Transit time (ocean, air, or domestic freight)
- Customs clearance if you're importing
- Amazon receiving time (currently longer than it was a few years ago)
- Time to go from "receiving" to "available" status in Seller Central
Add all of those up. That is your real lead time.
Seasonality, promotions, and demand shifts
If your product has a seasonal curve, you need to know it. Christmas ornaments sell differently in July than they do in November. Sunscreen sells differently in February than it does in May.
If you are planning a promotion, price drop, coupon, or ad push, you need to adjust your forecast to reflect the expected lift. Do not forecast off baseline sales if you are about to run a Lightning Deal.
Current on-hand, inbound, and reserved inventory
Check your current inventory position:
- Units available for sale right now
- Units inbound to FBA but not yet available
- Units reserved for customer orders or removals
Your forecast needs to account for what is already in the pipeline, not just what you need to order next.
How to Forecast Amazon Inventory Step by Step
Here's the method:
1. Calculate adjusted daily sales velocity
Take your recent sales and divide by the number of days in the window. If you sold 900 units in the last 30 days, your daily velocity is 30 units per day.
But do not stop there. Look at the data and ask: were there any days when you were out of stock? Were there any one-off spikes from a promo that is not repeating? Were there any days when you paused ads or lost Buy Box share?
If the answer is yes, you need to adjust.
2. Remove distorted periods like stockouts and one-off spikes
Sales data during a stockout is bad data. It understates true demand because you were not available to sell. If you had a stockout last month, do not use that period to calculate velocity. Either exclude those days or use a longer historical window that includes periods when you were fully in stock.
Same thing for one-off spikes. If you ran a Prime Day promo and sold 500 units in two days, do not treat that as normal daily velocity. Pull it out and forecast your baseline separately from promotional lift.
3. Add lead time coverage and safety stock
Once you have a clean daily velocity, multiply it by your total lead time in days. That gives you lead time coverage, which is the inventory you need to cover demand while the next order is in transit.
Then add safety stock. Safety stock is the buffer you carry to absorb unexpected demand spikes, supplier delays, or Amazon receiving delays. A common range is 15 to 45 days of additional coverage, depending on how predictable your demand is and how reliable your supply chain is.
If your velocity is stable and your supplier is reliable, 15 days might be enough. If demand is volatile or your supplier has a history of delays, carry more.
4. Set reorder quantity and reorder date
Your reorder quantity is lead time coverage plus safety stock.
Your reorder date is the date when your current on-hand inventory will fall below your safety stock threshold if you do not place a new order.
Check this weekly. If demand changes, your reorder date moves.
How Forecasting Changes by Product Type
Not every SKU should be forecast the same way.
Stable replenishment items
If your product sells at a steady pace with low variation month to month, use a simple 60- or 90-day average velocity, add lead time, add safety stock, and reorder on a regular cadence. These are the easiest SKUs to forecast.
Seasonal items
If your product has a seasonal curve, use year-over-year sales data for the same period you are forecasting. Do not assume this November will look like last month. Assume this November will look like last November, adjusted for any growth or channel changes since then.
Order earlier than you think you need to. Seasonal demand windows are short, and if you stock out during peak season, you lose the entire window.
New launches and relaunches
If you do not have historical sales data yet, you are forecasting off assumptions, not data. Start with a conservative initial order based on your launch plan and ad budget, then adjust quickly once you have a few weeks of real sales data.
Do not overbuy on a launch. It is easier to reorder fast than it is to liquidate excess inventory.
SKUs with volatile Buy Box or promo-driven swings
If your sales swing wildly based on whether you have Buy Box, whether you are running ads, or whether you are running promos, forecast your baseline and your promo-driven lift separately. Do not blend them into one number or you will either over-order for baseline periods or under-order for promo periods.
Common Forecasting Mistakes Amazon Sellers Make
Trusting short-term sales spikes too much
A two-week spike does not mean you have a new baseline. It means you had a spike. Wait until the pattern holds for at least 30 days before you treat it as the new normal.
Ignoring supplier and receiving delays
If your supplier says six weeks and you order based on six weeks, you are going to stock out. Build in buffer time for production delays, port delays, customs delays, and Amazon receiving delays. All of those happen.
Using one forecast method for every SKU
Stable products, seasonal products, and promo-driven products should not all use the same forecasting logic. Segment your catalog and apply the right method to each segment.
Failing to tie forecasting to ad and promo plans
If your ad spend is about to double or you are about to run a coupon, your forecast needs to reflect that. Forecasting and marketing need to talk to each other, or one of them will be wrong.
What Amazon Tools Can and Cannot Tell You
Amazon provides inventory management tools in Seller Central, including restock recommendations and inventory health dashboards. These tools are useful, but they have limits.
Seller Central restock guidance
The restock tool looks at recent sales velocity and suggests reorder quantities. It is a good baseline check, but it does not always account for:
- Seasonality beyond recent weeks
- Planned promotions or ad changes
- Supplier lead time changes
- Multi-channel allocation if you sell the same SKU outside Amazon
Use it as a sanity check, not as your only forecasting input.
Where built-in tools fall short
Amazon's tools are built for simple replenishment cases. They are less useful when:
- You are planning a launch or relaunch with no stable sales history
- You are managing a seasonal SKU with a sharp curve
- You are coordinating demand across Amazon, DTC, and wholesale channels
- You have long or variable lead times that require more planning than the tool assumes
When spreadsheets or third-party tools make sense
If you have more than a handful of SKUs, multiple suppliers, or complex demand patterns, you will eventually outgrow manual restock checks. At that point, either build a forecasting spreadsheet that pulls Seller Central data and applies your lead times and safety stock logic, or use a third-party inventory planning tool that can handle more variables.
The right tool depends on catalog size, channel mix, and how much time you want to spend managing inventory manually.
When to Get Help With Amazon Inventory Planning

Signs your team has outgrown manual forecasting
You know it is time to level up your forecasting process when:
- Your stockouts are happening because no one had time to place the reorder
- You are sitting on too much slow-moving inventory because the forecast was built off a promo spike
- Your team is spending more time firefighting inventory problems than planning ahead
- You are managing dozens or hundreds of SKUs and the spreadsheet is falling apart
Where SupplyKick can support planning and execution
At SupplyKick, we work with Amazon sellers to build inventory planning processes that tie forecasting to purchasing, inbound logistics, ad pacing, and cash deployment. We help brands move from reactive reordering to proactive planning, so stockouts and overstock become rare exceptions instead of constant problems.
Ready to build a forecasting process that actually works?
Learn how we integrate inventory planning into your broader Amazon strategy.
FAQ
How do you forecast Amazon inventory?
Start with clean sales velocity (units per day), multiply by total lead time (production + transit + receiving), add safety stock (15-45 days of buffer), and set a reorder date based on when your current inventory will hit your safety stock threshold. Review weekly and adjust when demand changes.
How much inventory should you send to Amazon FBA?
Send enough to cover expected sales during the full lead time plus safety stock. For most sellers, that means 60 to 120 days of inventory depending on lead times and demand stability. Avoid sending so much that you risk aged inventory fees or tie up cash you need elsewhere.
What is safety stock on Amazon?
Safety stock is the extra inventory you carry as a buffer against unexpected demand spikes, supplier delays, or Amazon receiving delays. A typical range is 15 to 45 days of additional coverage beyond lead time, depending on how predictable your sales are and how reliable your supply chain is.
Does Amazon's restock tool account for seasonality?
Amazon's restock tool uses recent sales velocity to generate recommendations. It does not fully account for year-over-year seasonality or planned promotions. If your product has a seasonal curve, use historical data from the same period last year instead of relying only on recent weeks.


